Unstructured Grids
Not all model output lives on a regular longitude × latitude grid. Models like ICON store their fields on an unstructured mesh. A variable has a single cell dimension (e.g. ncells), and the position of each cell is given by a pair of coordinate arrays (clon/clat) of the same length. CDFViewer handles such data without extra steps. You select clon and clat as plot axes like any other coordinate, and the cells are resampled onto a regular grid behind the scenes.
Opening ICON-style output
Our example atmos.nc stores the 2 m air temperature on an ncells dimension. The cell coordinates live in a separate grid file (see External grid files below), which is found and attached automatically.
cdfviewer atmos.ncatmos.nc — dims: time:12 ncells:4000
title: Unstructured demo output
grid file: icon_grid_0013_R02B04_G.nc
Coordinates:
clon [degrees] -179.969 … 179.93 (4000)
clat [degrees] -88.7188 … 88.7188 (4000)
time 2000-01-01 00:00:00 … 2000-01-12 00:00:00 (12)
Variable │ Dimensions │ Units │ Long name
──────────┼────────────────┼───────┼─────────────────────
temp2m │ clon,clat,time │ degc │ 2 m air temperatureThe coordinates clon/clat are now available as plot axes (radians are converted to degrees automatically).
CDFViewer> v temp2m
[ Info: Selected: temp2m
CDFViewer> x clon
[ Info: Selected: clon
CDFViewer> y clat
[ Info: Selected: clat
CDFViewer> p heatmap
[ Info: Selected: heatmap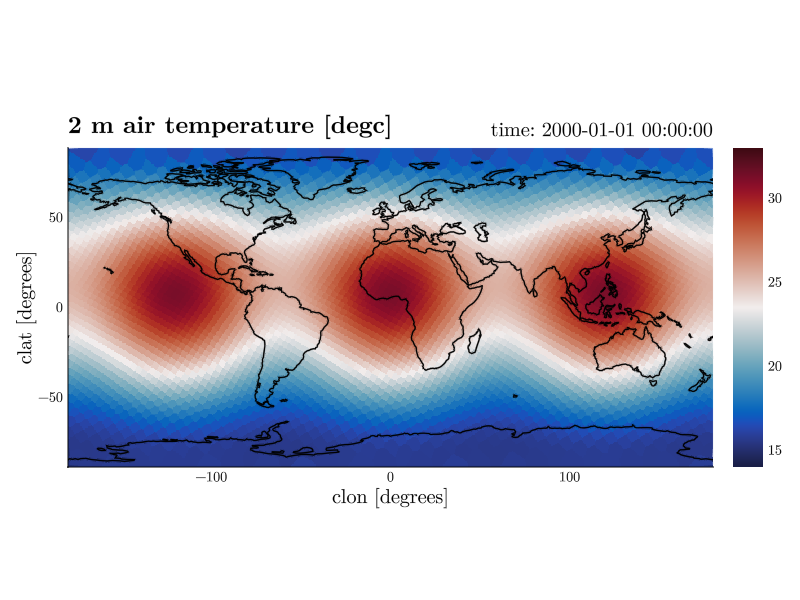
Controlling the interpolation
Unstructured cells cannot be drawn as a regular image directly, so CDFViewer resamples them with nearest-neighbor interpolation onto a regular grid. By default, each axis gets 500 sample points spanning the full range of the coordinate.
Both the window and the resolution can be changed per coordinate with a range keyword argument of the form
coordinate = (start, stop, number_of_points)For example, to zoom the interpolation into the tropics, sample each axis with 500 points across the smaller window, so the resolution there is correspondingly finer, and match the axis limits to the window.
CDFViewer> clon=(-60, 60, 500), clat=(-30, 30, 500), limits=(-60, 60, -30, 30)
┌ Info: Current plot settings:
│ clon => (-60, 60, 500)
│ clat => (-30, 30, 500)
└ limits => (-60, 60, -30, 30)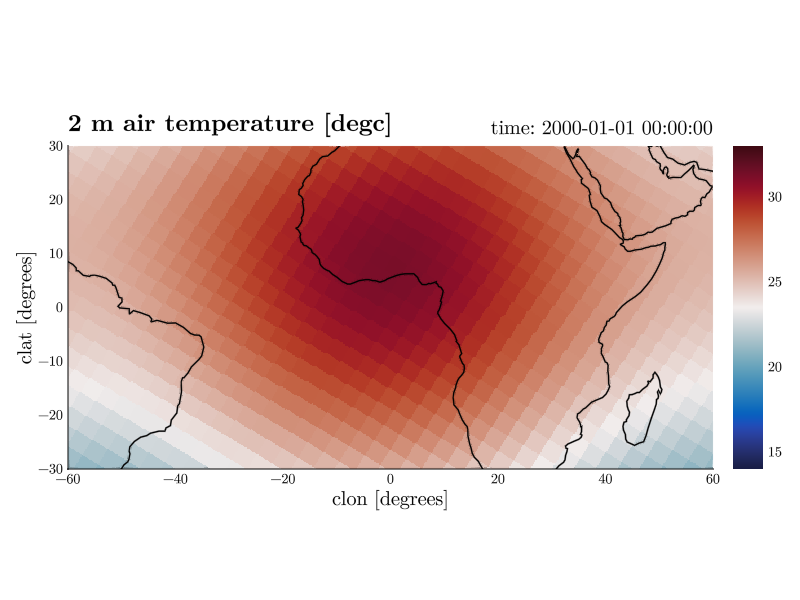
del restores the default ranges and limits.
CDFViewer> del clon clat limits
[ Info: Current plot settings:Press Ctrl-I in the figure window to toggle interpolation on and off, useful to check what the raw cells look like. The kwargs range command lists the coordinates that accept a range keyword.
External grid files
ICON data files often reference coordinates they do not contain. The coordinates attribute names clon/clat, but the arrays themselves live in a separate grid file. When CDFViewer detects such missing coordinates, it attaches them from a grid file.
You can always name the grid file explicitly.
cdfviewer atmos.nc --grid /pool/data/ICON/grids/public/icon_grid_0013_R02B04_G.ncWithout --grid, the directory of the data file and all configured search directories are searched in the following order.
- by the file name in the data file's
grid_file_uriattribute, - by the
icon_grid_<NNNN>_*.ncnaming convention, - by comparing the
uuidOfHGridattribute of everyicon_grid*.nccandidate, - optionally (opt-in), by downloading the file from
grid_file_uri.
Every match is verified against the data file before it is used. The grid uuid and the dimension sizes must fit. Automatic search can be disabled with --no-grid-search.
Search directories and the download option are set in the configuration file, e.g. to point at your own grid collection or a shared pool.
[grid]
search = true                       # master switch for automatic search
search_dirs = [
    "~/grids",                      # your own grid collection
    "/pool/data/ICON/grids/public", # e.g. the pool on Levante
]
download = false                    # opt-in: fetch grid_file_uri if not found
download_dir = "~/.cache/cdfviewer/grids"
See Configuration for where this file lives.