Getting Started
This page walks you through a first session. You will open a file, read the dataset overview, and make a plot. All following examples use a small synthetic weather dataset demo.nc, and every output and figure you see in this manual is produced by the real application at documentation build time.
Opening a file
Pass one or more NetCDF files on the command line (see Installation for how to set up the cdfviewer command).
cdfviewer demo.ncZarr stores work the same way. Pass the store directory instead of a file (cdfviewer output.zarr). A single zarr store is supported per session, while opening multiple paths at once (multi-file aggregation) is NetCDF-only. Only zarr format v2 can be read. v3 stores (zarr.json metadata) are detected, but the Julia zarr stack does not support them yet, so CDFViewer refuses them with an explanatory error.
When the file is opened, CDFViewer prints a compact overview of the dataset. It lists the dimension sizes, a coordinate block with units and value ranges, and a table of the data variables.
demo.nc — dims: lon:72  lat:36  time:24  lev:10
title: CDFViewer documentation demo dataset

Coordinates:
  lon   [degrees_east]   -180 … 175                                 (72)
  lat   [degrees_north]  -87.5 … 87.5                               (36)
  time                   2000-01-01 00:00:00 … 2000-01-24 00:00:00  (24)
  lev   [km]             0 … 18                                     (10)

 Variable    │ Dimensions       │ Units │ Long name
─────────────┼──────────────────┼───────┼───────────────────
 temperature │ lon,lat,time,lev │ degc  │ Air temperature
 humidity    │ lon,lat,time     │ %     │ Relative humidity
 pressure    │ lon,lat          │ hpa   │ Surface pressure
 u           │ lon,lat,time     │ m s-1 │ Eastward wind
 v           │ lon,lat,time     │ m s-1 │ Northward wind
After the overview, a CDFViewer> prompt appears. This is the command REPL, the keyboard-driven way to control the viewer. You can reprint the overview at any time with the overview command, or suppress it at startup with --no-summary.
Your first plot
Making a plot takes three choices. You select a variable (v), the plot axes (x, y, z), and a plot type (p). The first example plots a temperature map.
CDFViewer> v temperature
[ Info: Selected: temperature
CDFViewer> x lon
[ Info: Selected: lon
CDFViewer> y lat
[ Info: Selected: lat
CDFViewer> p heatmap
[ Info: Selected: heatmap
As soon as a valid plot type is selected, the figure window opens.
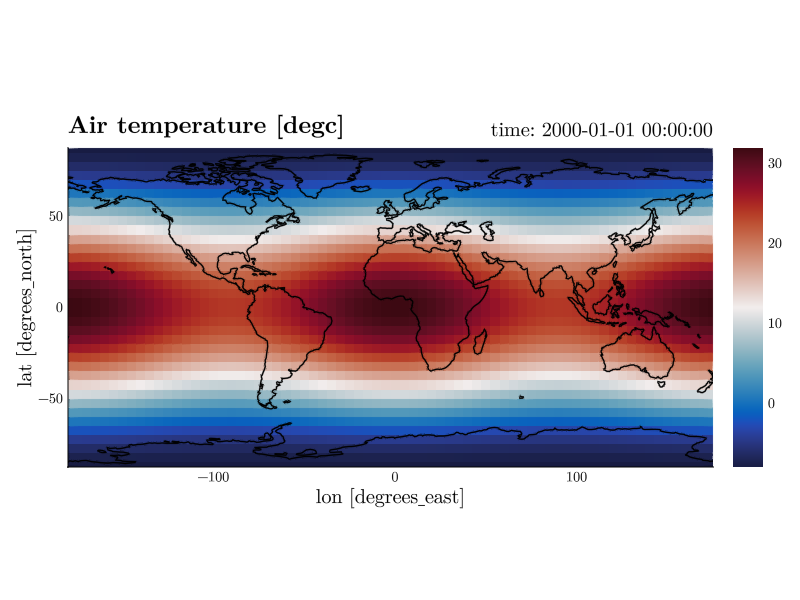
Every command completes the moment you press Enter, and the plot updates live. Type help for the full command list, or press TAB anywhere for completion (commands, variable names, plot types, and keyword arguments are all completed).
Fixing the remaining dimensions
Our temperature variable has four dimensions but the heatmap shows only lon and lat. The remaining dimensions lev and time are fixed at their first index. Change them with isel (by index) or sel (by coordinate value).
CDFViewer> isel time 12
[ Info:   → time: 2000-01-12 00:00:00
CDFViewer> sel lev 4.0
[ Info:   → height: 4 km
sel snaps to the nearest coordinate value, so you don't have to know the exact grid points.
Exploring with the mouse
The figure window is fully interactive.
- Hover over the data to inspect it. A tooltip shows the exact value under the cursor.
- Scroll to zoom, right-drag to pan, left-drag to zoom into a rubber-band selection, and Ctrl + left-click to reset the view.
- In 3D plots (
surface,wireframe,volume,contour3d), left-drag rotates the camera instead.
On geographic maps, drag-panning is disabled by default so the projection stays put. Unlock it with the moveable=true keyword (see Customizing Plots).
The two windows
CDFViewer manages two windows. The figure window shows the plot, and an optional menu window offers dropdown menus, sliders, and buttons for everything you select: the variable, the axes, the plot type, and the playback. Open the menu with the menu command (or start with --menu). See The Menu Window.
Where to go next
- The Command REPL explains history, completion, and line editing.
- Selecting Data treats variables, axes, and coordinates in depth.
- Plot Types shows all nine plot types with examples.
- Customizing Plots covers colormaps, labels, and map projections.
- Animation and Playback plays a dimension like a movie.
- Saving and Recording exports figures, videos, and sessions.